Soya Production and Global Impact
Soy has earned itself a bad reputation with many consumers. Its links to deforestation means that, alongside palm oil, soy has become a product to avoid. Is this reputation justified?
In this article we will take a look at the story of soy: how production has changed over time; where it is produced; what it is used for; and whether it really has been a key driver of deforestation. Although the research suggests that by far the largest driver of deforestation in the Brazilian Amazon has been driven by the expansion of pasture land for beef production, soy is likely to have played at least some role in the loss of forest.
More than three-quarters (77%) of global soy is fed to livestock for meat and dairy production. Most of the rest is used for biofuels, industry or vegetable oils. Just 7% of soy is used directly for human food products such as tofu, soy milk, edamame beans, and tempeh. The idea that foods often promoted as substitutes for meat and dairy – such as tofu and soy milk – are driving deforestation is a common misconception.
How has demand for soy changed over time?
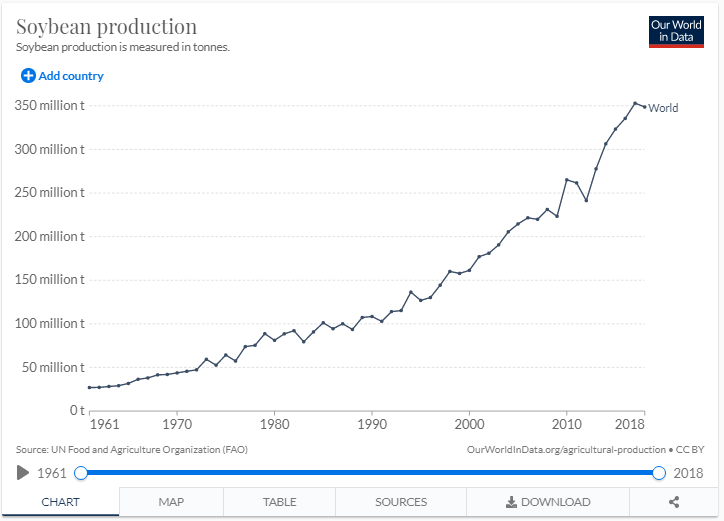
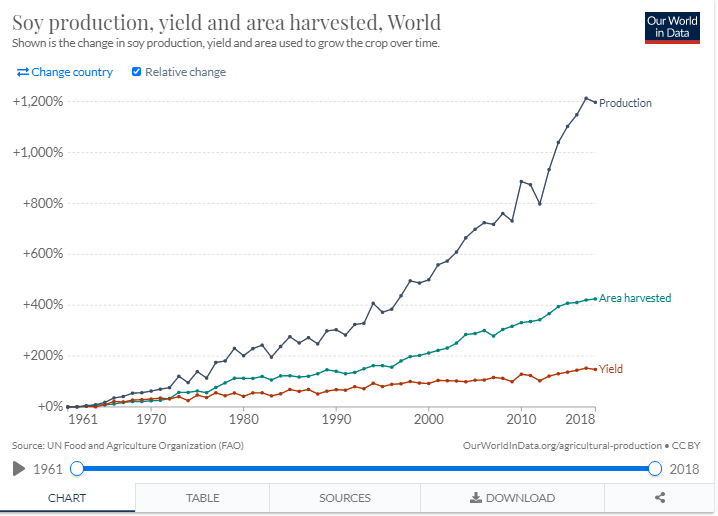
Global soy production has exploded over the past 50 years. Global production today is more than 13 times higher than it was in the early 1960s. Even since the year 2000, production has more than doubled.
In the chart here we see the change in global soybean production from 1961 onwards.1 Back in the 1960s, we were producing 20 to 30 million tonnes per year. This is now 350 million tonnes.
We can increase agricultural production in two ways: by improving yields (growing more on a given plot of land) or expanding the amount of land we use. As we will see later, although countries have seen yield gains over time, much of the increase in production has been driven by the expansion of croplands. Unfortunately, some of this has been at the expense of forests.
Which countries produce the most soy?
Global soy production has increased rapidly over the past 50 years. But to understand whether this has come at a major environmental cost, we also need to understand where this growth has come from.
Which countries are the main producers of soy?
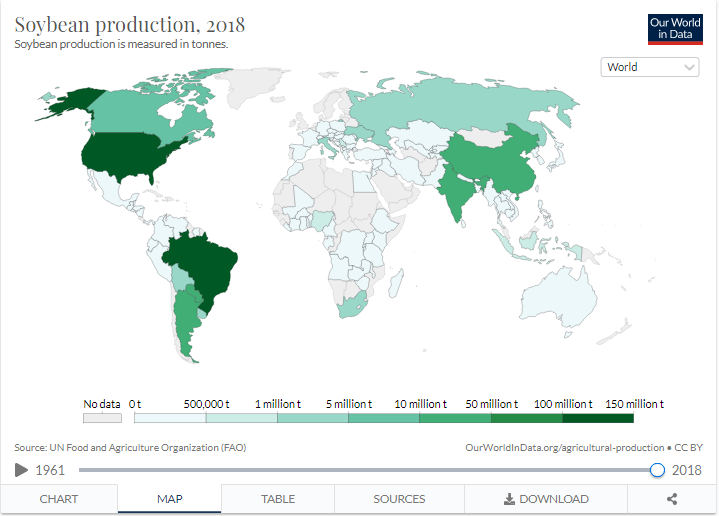
In the map we see the distribution of soybean production across the world. Most of the world’s soy comes from only two countries: the US and Brazil. Combined, they account for more than two-thirds (69%) of global soy production.2 In fact, they produce almost exactly the same amount: in 2018 the US produced 123 million tonnes, and Brazil 118 million tonnes. Individually, they each account for around one-third of global production. The other major producer is Argentina, which accounts for 11% (at 40 million tonnes).
To understand soy as a potential driver of deforestation, it’s also useful to understand how each country’s production has changed over time. It is the change in production, and how this was achieved (either increased yields or cropland expansion), that is the potential driver of deforestation.
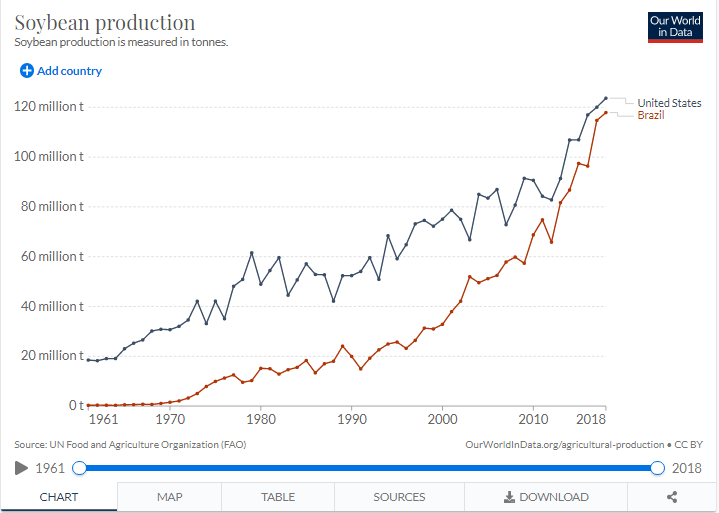
In the other chart we see the change in soy production in Brazil and the US. The US was already producing a lot of soy throughout the 1960s, 70s and 80s and so its growth in recent decades has been much slower than Brazil. The US was growing 20 million tonnes per year as early as 1960. Brazil did not reach this level of output until 1990 – three decades later. This means that its rate of growth in the last 30 years has been much faster.
More than three-quarters of global soy is fed to animals
Before we look at the evidence for whether Brazilian soy is responsible for the clearing of the Amazon, we should first understand what products have been driving this growth.
When someone mentions soy we often think about foods such as tofu, soy milk, tempeh or edamame beans. This feeds into the argument that meat and dairy substitutes – such as switching from meat to high-protein tofu, or from dairy to soy milk – is in fact worse for the environment. But, only a small percentage of global soy is used for these products. More than three-quarters (77%) of soy is used as feed for livestock.
In the chart here we see the breakdown of what the world’s soy was used for in 2018. On the left we have total global soy production; in the middle, the three categories of uses (direct human food, animal feed, and industrial processes); and on the right we have the end use products. This data is sourced from an analysis published by the University of Oxford’s Food Climate Research Network (FCRN), which relies on the USDA’s PSD database.3 Over one-third (37%) of global soy is fed to chickens and other poultry; one-fifth to pigs; and 6% for aquaculture. Very little soy is used for beef and dairy production – only 2%.
One-fifth of the world’s soy is used for direct (i.e. not from meat and dairy) human consumption. Most of this is first processed into soybean oil. Typical soy products such as tofu, soy milk, tempeh and edamame beans account for just 7% of global demand.
Soy can also be used for industrial purposes. Around 4% is used for biofuels, lubricants and other industrial processes. Biodiesel alone accounts for 2.8%.
We might therefore conclude that the increased demand for soy has been driven by a growing appetite for meat, dairy and soybean oil. But to double-check we should look beyond this static single-year view and see how demand has changed over time. Maybe demand for these products has always been high, and instead the growth in demand has come from the increased popularity of products such as soy milk and tofu.
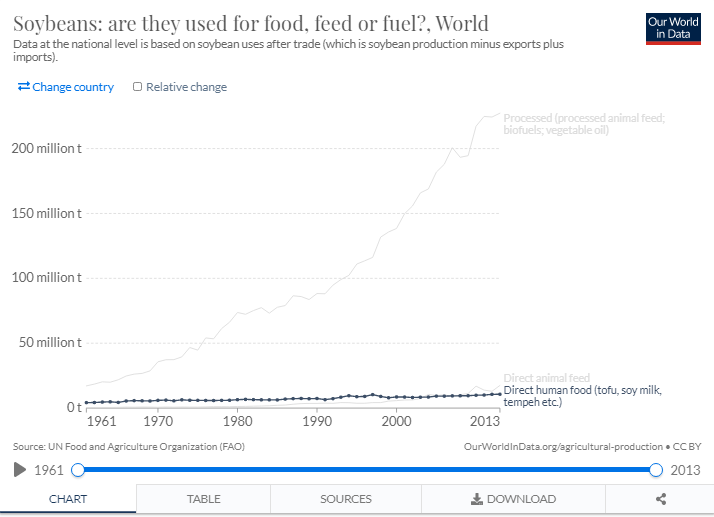
In the chart we see the allocation of soybeans to three categories. Processed products include all animal feed from soybean cake (i.e. 70% of global demand); soybean oil; and industrial products such as biofuels. Direct human food includes all non-animal-sourced foods from soy excluding oils. Direct animal feed is soybeans fed directly to livestock (rather than been processed into soybean cake first).
We see that most of this growth has come from the increased demand for processed soy – animal feed, biofuels and vegetable oil. This rise has been particularly steep since 1990. By 2013, it had increased from 88 million to 227 million tonnes. Over this period, demand for human food products such as tofu and soy milk increased by only 3 million tonnes (from 7.4 to 10.7 million).
This should not surprise us. Global meat production has more than tripled over the last 50 years. This increase has been most marked for poultry – the largest consumer of soy feed.
Using the ‘change country’ toggle you can see how this allocation varies by country. For example, we see that this distribution is similar for Brazil.
Is soy production driving deforestation?
So far we’ve established that demand for soy has increased rapidly over the past 50 years; most soy is produced in the US, Brazil (and to a lesser extent, Argentina); and most of this has been driven by increased demand for animal feed, biofuels and vegetable oils.
The big question is whether this has been a key driver of deforestation.
The first step to answering this is to understand whether the amount of land we use to grow soy has increased. If improvements in crop yields were able to keep up with this rise in production then we wouldn’t need any additional land, and there would be no need to cut down forests.
Brazil has devoted increasing amounts of land to soy production. But has this come at the expense of forests? Has the Amazon been cleared to make room for it?
This is a question many researchers have tried to answer. What makes it complex is that agricultural and land use systems are intricately linked: it’s possible to assess whether soy production has a direct impact on deforestation, but much harder to understand whether it is indirectly causing harm elsewhere.
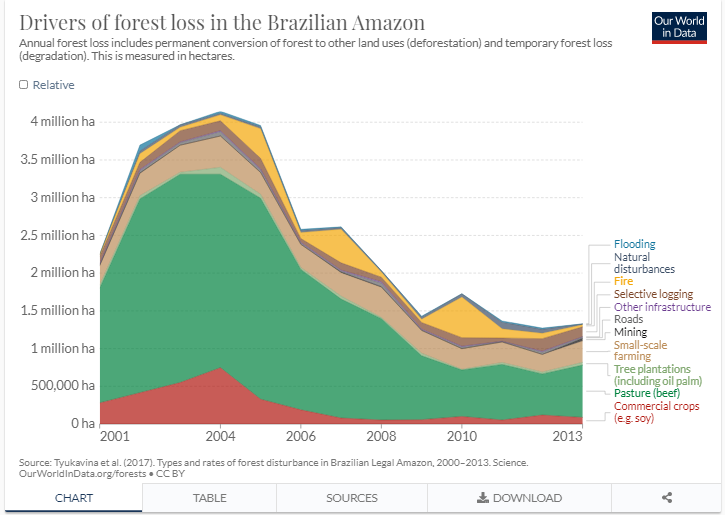
In a study published in Science, Alexandra Tyukavina et al. (2017) look at the drivers of forest loss in the Brazilian Legal Amazon.4 The change in these drivers from 2000 to 2013 is shown in the chart. Note that this overall trend suggests a major decline in forest loss since 2000 – unfortunately in the years since 2013, rates have increased again.
From this, we would conclude that the dominant driver of deforestation in the Brazilian Amazon was the expansion of pasture for beef production. If we look at forest loss from commercial crops – which is mainly soybeans – we see a significant decline, especially following the introduction of ‘Brazil’s Soy Moratorium’. The ‘Soy Moratorium’ was a campaign involving civil agencies and soybean companies, which stipulated that farmers who grew soy on illegal or legal deforestation areas would not be able to sell them to suppliers. Since 2009, satellite imagery has been used to help to identify soybean crops being grown on deforested areas.5
Numerous studies have reached a very similar conclusion: it is pasture, not soybean production that is driving most deforestation in the Brazilian Amazon.6,7.8 But, this only looks at the direct drivers of deforestation. In other words, the cutting down of forest today to make space for cropland for soy production.
The indirect impacts of soy production
Soy may no longer be a direct driver of deforestation in the Brazilian Amazon. But we should also think about the indirect impacts of increased production. We know that the area being used to grow soy is still increasing, and that land has to come from somewhere. In particular regions, such as Mato Grosso, studies have found that instead of replacing forest, these croplands are replacing pasture.9 If this pasture land is simply shifting into forested areas, we could argue that soy is still a major underlying cause of deforestation.
A recent study by researchers Nikolas Kuschnig, Jesús Crespo Cuaresma, and Tamás Krisztin reached this conclusion.10 They combined high-resolution satellite imagery from the Mato Grosso region in Brazil with socioeconomic panel data to not only quantify the direct impacts of soy production, but also the spillover effects. The results suggest that by only looking at direct impacts we are underestimating the role that soy continues to play in deforestation.
It’s also the case that the Amazonas region in Brazil gets most of the attention. But most soy is now grown in other regions of the country. In 2015, only 13% came from the Amazon, while 48% came from the Cerrado region.11 Some researchers therefore make a strong case that interventions such as the ‘Soy Moratorium’ need to be extended to cover regions beyond the Amazon if they are to be effective. Without wider implementation of these policies, we will continue to see deforestation simply shift elsewhere.
Whilst the expansion of pasture for beef production is the leading driver of deforestation in Brazil, soy still plays a significant role when we take its indirect impacts into account. To end deforestation, there are a couple of key actions we can take. For consumers, since most deforestation is driven by expanding pastures for beef, or soy to feed poultry and pigs, reducing meat consumption is an effective way to make a difference. For companies and regulators, zero-deforestation policies must be more widely implemented (i.e. not only focused on the Amazon) and must be more carefully designed to take spillover effects into account.